
Improving Your Critical Appraisal Skills #1
The Randomized Control Trial

Why start this series with the RCT? RCTs are used to determine if one treatment is better than another. They are clinical experiments that provide medicine’s most reliable data. When there is a good RCT, one that can be generalized to a specific patient’s situation, there is no better guide. However, RCTs are far from perfect. Individually, their design may lead them to include important biases and not be generalizable. More generally, because of publication bias, the literature of RCTs is also biased. The conclusions that come from RCTs concern populations while our decisions, either as patients or doctors, concern individuals. It hardly needs to be stated that RCTs (let alone unbiased, generalizable RCTs) are available for the minority of decisions.
Design of Randomized Controlled Trials
Participants are selected and then randomly divided into two groups. The “experimental” group is exposed to an intervention; the control group is treated identically to the experimental group, except that it is not exposed to the intervention. The two groups are then observed for differences in outcome.

Selection Bias
Reduction of selection bias is the primary strength of the RCT. Selection bias occurs when the groups studied are different with respect to determinants of outcomes in ways besides the experimental intervention. The weakness of observational trials is that the groups are (almost) always different in ways besides the exposure of interest. If selection bias is present, the groups will not have the same prognosis before the intervention is made, and differences in outcomes cannot be attributed to the intervention alone.
The beauty of the RCT is that not only are measured clinical characteristics balanced between the groups. Unmeasured ones and ones whose importance are unknown are distributed randomly/equally. If we discover a critical risk factor or predictor in the years after a trial is completed, we can be sure that this factor had the same prevalence in the treated and control group.
Stratification is commonly used in RCTs to further reduce the risk of selection bias. Here, one or two important risk factors are chosen before the study, and randomizations are done within each risk factor group.

Stratification guarantees balance of the most important risk factors. If the power of the study enables, stratification also allows for conclusions within each group.
Controlling for the Reintroduction of Selection Bias: Lost to Follow-Up and Intent to Treat
Selection bias can be re-introduced into a randomized trial. The two most common ways selection bias is reintroduced is if participants drop out of the study or if they receive care different from their assigned care.
First, if participants are lost to follow-up, the two groups might not stay similar as participants may not be lost in a random way. There are two primary ways to tell if “loss to follow-up” is important.
1. If those lost to follow up are demographically similar to those who remained in the study, if the dropout rate is about the same for placebo and treatment, and if the reasons for drop out are similar for participants assigned to placebo and treatment, it suggests (but does not prove) that bias has not been re-introduced. The articles that report on RCTs usually contain a flow diagram that provides this information.
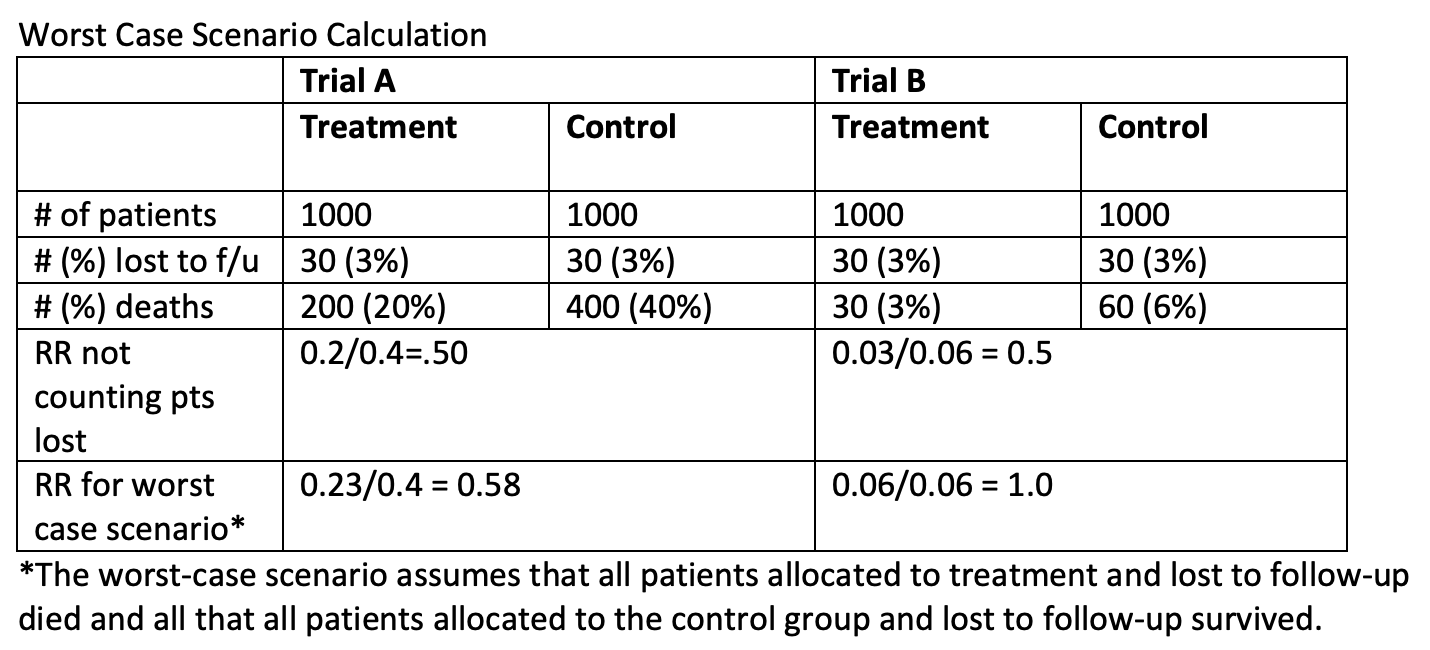
2. You can also calculate a “worst case scenario.” Assume that all those in the treatment group lost to follow up have the worst outcome and all of those in the placebo group lost have the best outcome. If doing this doesn’t change the results, you can be confident that the dropout rate doesn’t matter. If it does change the results, you must decide how likely it is that the “worst case” occurred.
Selection bias can also be reintroduced if the researchers do not perform an “intent to treat” (ITT) analysis. Intent to treat analysis means that participants are analyzed in the groups to which they were initially assigned, regardless of whether they received the assigned therapy. In the figure below, this would mean that A and B are compared to C and D even though participants in group B essentially took the placebo and those in group C got the active treatment.

ITT analyses have a few benefits:
1. They maintain randomization. After all the effort to randomize participants, you cannot then allow them to opt in or out of the assigned groups. Participants who are nonadherent to the study protocol are likely different than those who are adherent; leaving out these people or including them in the placebo group will disrupt the balance that randomization ensures.
2. ITT analyses will generally make it harder to show a difference as the actual difference in exposure to treatment will be attenuated. ITT is therefore considered a conservative approach.
3. ITT more closely mimics the real-world situation in which not all people follow treatment recommendations.
The alternative analysis is called a “per protocol” analysis. In per protocol analyses, participants who received therapy (either through adherence in the intervention group or through treatment outside the trial) are compared to those who did not receive therapy. In the figure, A and C would be compared to B and D. If the per protocol and intention to treat analyses give the same results, you can be confident that the dropouts and crossovers were not numerous enough to affect the results. You should be suspicious if a paper reports only a per protocol analysis.
For reasons that might already be, and will become, obvious, a per protocol analysis is appropriate when comparing adverse effects and in non-inferiority trials – situations in which you do not want to minimize the likelihood of finding a difference. There is great about debate of which type of analysis is more appropriate in screening trials.
Blinding (Measurement and Reporting Bias)
If participants are not blinded to their assignment, there may be reporting bias. Through the placebo and nocebo effect, participants who are aware they are getting an experimental intervention may be more or less likely to report benefits or adverse effects. If physicians and researchers are not blinded, they might treat participants in the different groups differently and measure outcomes differently. In a single blind study, participants are blinded to assignment. In a double-blind study, participants and researchers are blinded. The more objective the outcome, the less important it is to blind.
Sampling Bias
Researchers must choose study participants carefully. They must be sick enough that they might benefit from the treatment but not so sick that treatment has no chance of providing benefit. We do not just want studies to inform us whether or not an intervention is helpful to study participants. We want the results to be generalizable, to have external validity. Sampling bias occurs if the participants in a study are not representative of the population you are treating (or belong to as a patient). Sampling bias can be introduced in many ways. Some factors to consider:
1. Exclusion: The investigators exclude complicated or very sick patients.
2. Refusal: People who agree to participate might be different than those who do not.
3. Site of study: Participants enrolled at university centers might be different than those in the community.
4. Run-in period: Participants are given the treatment medication for a period of time prior to randomization; this ensures that everybody in the study can tolerate the drug.
5. Demographic differences: Are there reasons that a treatment in one demographic might have different effectiveness than the same treatment applied to a different one?
Sample Size Calculations (a error, b error, and power)
The results of a study do not always represent truth. We build error into our statistics. The 2X2 table below defines a and b error. In the table the four boxes represent the possible results of a study. The left most column are the results of the study. The top row is the truth (how does the treatment actually compare to placebo). Possible outcomes are a true positive result (study shows a difference when there is one), a true negative result (study shows no difference when there is not one), a false positive result (study shows a difference when there is not one), and a false negative result (study shows no difference when there is one).

a error is finding a difference when one does not exist.
b error is not finding a difference when one exists.
Power (1-b) or the probability of finding a difference when one exists.
To calculate the sample size of a study, researchers must know the a, b, the predicted magnitude of outcome difference between the groups, and the predicted variability of the outcome measure (standard deviation). In the end, sample size is directly proportional to power and the variability of the measurement and inversely proportional to the a error and the effect size.
The Numbers
Results can be reported as either relative differences or absolute differences. Relative differences will be reported more often, usually sounds more impressive than absolute differences, which may be more important for counseling patients.
X = the proportion who reach the designated outcome in the control group (the control event rate)
Y = the proportion who reach the designated outcome in the treatment group (the experimental event rate)
Relative risk (RR) = Y/X = the risk of events in the treatment group relative to the control group
Relative risk reduction (RRR) = (1-Y/X) x 100% = percent reduction in events in the treatment group compared to the control group
Absolute risk reduction (ARR) = X - Y = the absolute difference between the two groups
NB: sometimes the treatment increases the proportion of participants reaching the designated outcome; then there is an absolute risk increase (ARI) or relative risk increase (RRI)
Number needed to treat = 1/ARR = number of patients you need to treat in order to prevent one adverse event
Number needed to harm = 1/ARI = number of patients you need to treat in order to cause one adverse event
Example 1:
20/100 participants in the control group die
15/100 participants in the treatment group die
X = 20/100 = 0.2
Y = 15/100 = 0.15
RR = Y/X = 0.15/0.2 = 0.75
RRR = (1 - Y/X) x 100% = (1 - 0.75) x 100% = 25%
ARR = X - Y = 0.2 - 0.15 = 0.05
NNT = 1/ARR = 1/0.05 = 20
Example 2:
4/100 participants in the control group die
3/100 participants in the treatment group die
RR = 0.03/0.04 = .75
RRR = (1-.75) x 100% = 25%
ARR = 0.04 - 0.03 = 0.01
NNT = 1/0.01 = 100
Note that even though the relative risk and relative risk reductions are the same in examples 1 and 2, the number needed to treat is much higher in example 2. This happens because the event rate is lower.
Example 3:
2/100 participants in the control group have a GI bleed
6/100 participants in the treatment group have a GI bleed
RR of a bleed in the treatment group = 0.06/0.02 = 3
ARI (absolute risk increase) in the treatment group = 0.06-0.02 = 0.04
NNH (number needed to harm) = 1/0.04 = 25
Relative Risk vs. Hazard Ratio
Currently, hazard ratios are reported more often than relative risks in RCTs. Hazard ratios can be thought of as relative risks that compare the two populations at every point in time. In a study like that shown below, where the final outcome is the same in both groups, the RR=1. However, the HR≠1 because the two groups take different amounts of time to reach the endpoint. Whether RR or HR is the more appropriate metric depends on the study. If the X axis is in years and the Y axis is survival, you would certainly rather be in the control group. If the X axis is days and the population is patients admitted to the Neurology ICU, you might say the intervention is superior.

RCTs can be Misleading
Although, in many situations, RCTs are the most reliable source of evidence, they can be misleading. Whole books could be written about this topic. (In fact, much of Ending Medical Reversal is about how even well done RCTs can lead us astray.) Below are some common things to consider when appraising a RCT. This list could continue for pages.
1. For studies with a subjective endpoint, was the control really adequate? For surgical or procedural interventions, this will often mean a sham control.
2. Always be cautious about surrogate endpoints. There are dozens of examples of treatments improving surrogate endpoints but not the clinical ones the surrogates are meant to stand in for.
3. Consider the “pre-study” probability that the treatment is effective. If there is a 50% likelihood that a treatment is effective, a positive study is correct 94% of the time. On the other hand, if there is a 10% likelihood that a treatment is effective, a positive study is correct only 64% of the time.
4. Remember that trials terminated early systematically overestimate effects.
5. Never forget that publication bias exists.
The course that led to the first drafts of these posts was all about reading classic articles. Here are some wonderful examples of RCTs. N.B., a few of the conclusions reached in these trials are dead wrong. I’ll leave it to you do pick those out.
Steering Committee of the Physicians’ Health Study Research Group. Final Report on the Aspirin Component of the Ongoing Physicians’ Health Study. NEJM 1989;321:129-135.
Echt, D.S. et al. Mortality and Morbidity in Patients Receiving Encainide, Flecainide, or Placebo: The Cardiac Arrhythmia Suppression Trial. NEJM 1991; 324: 781-788.
The Diabetes Control and Complications Trial Research Group, The Effect of Intensive Treatment of Diabetes on the Development and Progression of Long-Term Complications of Insulin-Dependent Diabetes Mellitus. NEJM 1993; 329: 977-986.
Shepherd J, et al. Prevention of coronary heart disease with pravastatin in men with hypercholesterolemia (West of Scotland Coronary Prevention). NEJM 1995; 333:1301-7.
Hulley S, et al. Randomized trial of estrogen plus progestin for secondary prevention of coronary heart disease in postmenopausal women (HERS). JAMA 1998; 280:605-13.
Rivers E, et al. Early goal-directed therapy in the treatment of severe sepsis and septic shock. NEJM 2001; 345:1368-77.
Moseley JB, et al. A Controlled Trial of Arthroscopic Surgery for Osteoarthritis of the Knee. NEJM 2002; 347:81-88.
Boden WE, et al. Optimal medical therapy with or without PCI for stable coronary disease. NEJM 2007. 356:1503-16.
Miller K, et al. Paclitaxel plus Bevacizumab versus Paclitaxel Alone for Metastatic Breast Cancer. NEJM 2007;357:2666-76.
Buys SS, Partridge E, Black A, et al. Effect of Screening on Ovarian Cancer Mortality. JAMA. 2011;305:2295-2303.
Nood EV, et al. Duodenal Infusion of Donor Feces for Recurrent Clostridium difficile. NEJM 2013;368:407-15.
Villanueva C, et al. Transfusion Strategies for Acute Upper Gastrointestinal Bleeding. NEJM 2013;368:11-21.
The Process Investigators. A Randomized Trial of Protocol-Based Care for Early Septic Shock. NEJM 2014;370:1683-93.
Meyer G, et al. Fibrinolysis for Patients with Intermediate-Risk Pulmonary Embolism. NEJM 2014;370:1402-11.
Toit GT, et al. Randomized Trial of Peanut Consumption in Infants at Risk for Peanut Allergy. NEJM 2015;372:803-13.
Questions from JAMA’s Users’ Guides to the Medical Literature for articles about therapy
1) Was the assignment of patients to treatments randomized?
2) Were all patients who entered the trial properly accounted for and attributed at its conclusion?
a) Was follow-up complete?
b) Were patients analyzed in the groups to which they were randomized?
3) Were patients, health workers, and study personnel “blind” to treatment?
4) How large was the treatment effect?
5) How precise was the estimate of the treatment effect?
6) Can the results be applied to my patient care?
7) Were all clinically important outcomes considered?
8) Are the likely treatment benefits worth the potential harms and costs?
Good review, and some of us (speaking for myself) learned a couple of new points. Here are a few additional points:
- Untoward effects are typically understated to make the intervention look better. E.g. The benefit of the intervention is often reported as a relative risk reduction, but the harms reported as an absolute risk increase.
- The authors may focus on a single clinical outcome such as fewer acute cardiac events, but de-emphasis a more important one, such as all-cause mortality. My favorite illustration of this is the Helsinki Heart Study demonstrating reduced MI, but increased all-cause mortality from gemfibrizil.
- "P hacking": The researchers report a benefit for a subgroup of subjects, among a vast number of possibilities, especially if not mentioned in the study protocol. They really really want to show a benefit of the intervention for someone - anyone!
- My favorite: The study authors' choice of language that subtly convey the desirability of an intervention. E.g. The phrase "horrors of covid" or any use of the word "crisis" has an emotional appeal to imply that the tested intervention is desirable. Or reporting an untoward effect by the phrase "Only 1% of subjects were hospitalized for GI bleeding.". The word "Only" is meant to bias the reader to think the negative effect is trivial.
Perhaps Dr Cifu is planning a column on the ways by which researchers frame a study to promote an intervention rather than report data and let the reader decide its benefits and harms. To me, these practices are pervasive in the literature and undermine the conclusions of many, if not most, studies.
This was so good. I’m glad you plan to put this out there for more folks can critically look at themselves and others’ practice skillsets as the literature is more and more catering to those that fund rather than results that matter. I learned a lot here!
I also immediately check who funded the study.