
No, The LA Fires Did Not Cause Excess Deaths as Reported in JAMA
A Sensible Medicine Guest Post

Since the launch of Sensible Medicine, one of our goals has been to offer an alternative to Letters to the Editor, one that allows quick turnaround and active debate. I am happy to post this comment from frequent contributor Edward H Livingston, MD, FACS, regarding a recent article that was published in JAMA and then widely covered in the news.
Adam Cifu
“California Wildfires May Have Caused Hundreds More Deaths,” said the US News headline on Aug. 7, 2025. Similar headlines appeared in 238 other newspapers that day. A scary headline, but unfortunately, wrong. The wrong conclusion about these deaths came from a widely promoted JAMA article that reported an analysis violating several basic scientific principles: failing to understand or fully vet the analyzed data and lacking a control group.
JAMA published a research letter reporting findings from a CDC WONDER query of weekly death rates in Los Angeles County during the weeks when the catastrophic Pacific Palisades and Eaton fires occurred. They compared death rates to those in 2018, 2019, and 2024 (excluding the COVID years) with those in 2025, using an interrupted time series approach.
Interrupted time series is a methodology that enables one to estimate the effect of some event on an outcome based on statistical modeling of the event rate before and after the intervention, and determining the difference. When this was done, the investigators concluded that there were 440 deaths in Los Angeles in excess of the 30 that were known to have been caused directly by the fires.
From the supplemental methods:
“We extracted death counts for all causes, excluding influenza and pneumonia and codes for special purposes including COVID-19 (J09-J18 and U00-U49), excluding all respiratory diseases and codes for special purposes (J00-J98 and U00-U49), and excluding external deaths and codes for special purposes (V01-Y89 and U00-U49).” “excluding external deaths and codes for special purposes (V01-Y89 and U00-U49).”
This series of exclusions was intended to include only deaths not caused directly by the fires. A limitation in the study is reliance on cause of death information in CDC WONDER, which is populated by the underlying diagnoses found in death certificates. Although the basis article reviewed here was published in JAMA, there is a JAMA Internal Medicine article entitled “Problems With Proper Completion and Accuracy of the Cause-of-Death Statement” that stated, “The reliability and accuracy of CODs remain a significant problem.” Since JAMA declared that death certificate cause of death information is unreliable, they should not have published an article based on what they had previously informed us was untrustworthy data.
Having said that, these exclusions were moot. “COVID-19 (J09-J18 and U00-U49)” overlapped “all respiratory diseases and codes for special purposes (J00-J98 and U00-U49)” because J09-J18 is a subset of J00-J98. There were no data in CDC WONDER for these combinations of codes for 2018 and 2019.
All-cause mortality is one of the cleanest outcomes possible for any study using a mortality endpoint. Counting deaths is simple and accurate. Determining the cause of death is always difficult. Whenever cause-specific mortality is used in research studies, it is essential to know that the cause of death was verified in some reliable way. Readers of the medical literature should be biased in favor of believing research findings reporting all-cause and not cause-specific mortality.
Another basic flaw in the LA fire analysis is the lack of a control group. Having an experimental group compared with a control allows investigators to isolate the effect of the intervention from other processes that can influence the outcome of interest. Control groups were readily available to the investigators who analyzed LA fire-related deaths.
The fires were caused by Santa Ana winds. These winds occur annually in Los Angeles, blowing hot air from the Mojave Desert southwestward toward the ocean over Los Angeles. These winds are associated with major fires every year. Because of their directionality, smoke and debris from these fires travel south and west. The counties north (Ventura) and east (San Bernardino) are not affected as they are upwind.
I reconstructed the analysis published in JAMA, avoiding problems associated with cause of death uncertainty by only studying all-cause mortality and including the controls of deaths occurring in Ventura and San Bernardino counties. I found exactly the same increases in excess mortality in the control counties as was observed for Los Angeles County.
Figure 1 shows excess deaths for the 3 counties.
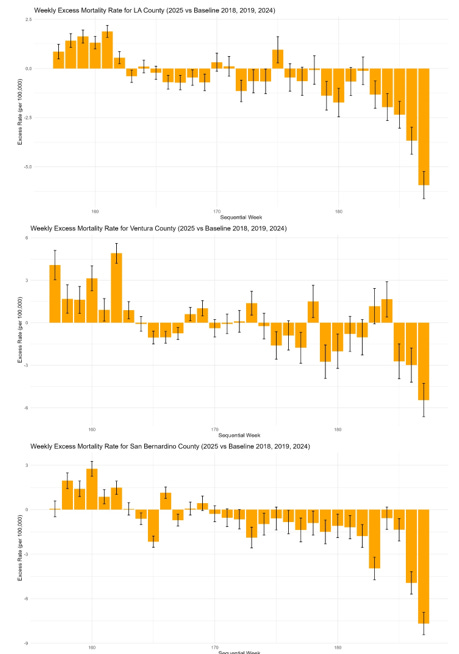
Figure 2 shows the results of the interrupted time series analyses.
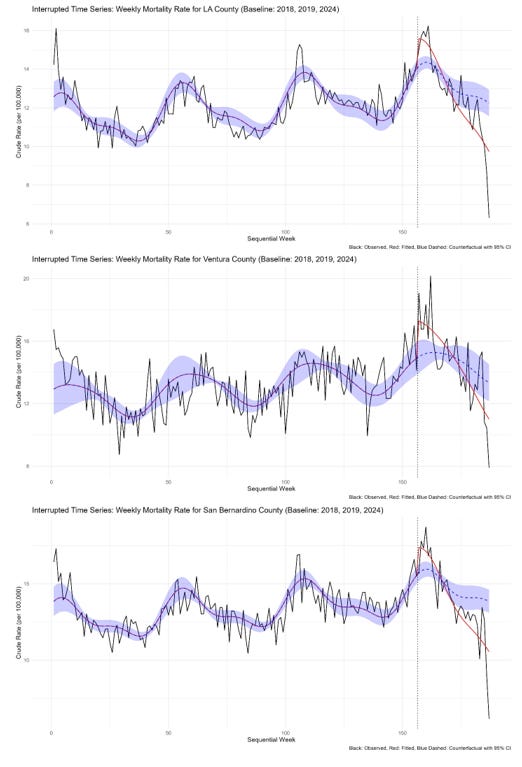
Points #1-#52 represent weekly death rates (per 100,000 population in the county) for 2018, #53-#104 for 2019, #105-#156 for 2024, and #157-187 for weeks 1-31 that were available for 2025 when this analysis was done. In an interrupted time series analysis, the years of data are attached to one another. Those before the intervention are fit using techniques that account for seasonal changes that occur naturally. Terms are added to the regression model at, and after, the intervention to allow for the model to fit the data observed under the new conditions. In these figures, the black line shows the actual observed data, the red the fitted mortality estimated from the model, and the blue dashed line and shading the fitted data using the model coefficients that were calculated from the data before the event occurred. The difference between the blue and black lines is the excess deaths.
All 3 counties had excess deaths during the weeks of the fire (weeks #2-5 in the 2025 data). Because the control counties were not affected by smoke and debris from these fires, the observed excess deaths observed in 2025 relative to 2018, 2019, and 2024 were probably caused by factors other than the fires.
Errors in the published JAMA article stem from a failure to understand the data being analyzed, a common mistake in science. The conclusion “These additional deaths likely reflect a combination of factors, including increased exposure to poor air quality and health care delays and interruptions” is not supported by the data. It is conceivable that, because the investigators are from Finland and Boston, they may not have understood how Santa Ana winds work. They might not have understood that adjacent counties to the North and East would not be affected by poor air quality. Because of that, these counties could serve as controls. When this was done, the analysis showed the same excess death pattern, arguing against the fires causing excess deaths in Los Angeles. The authors also seem unaware that, apart from the fire zone itself, there was no interruption in health care delivery in Los Angeles during the fires.
There were no apparent excess deaths in Los Angeles because of the fires. But because of a poorly constructed analysis widely distributed by an uncritical press, the world believes there was.
This faulty analysis highlights the need to understand data integrity and the context in which data is collected. It also shows the importance of data availability for others to verify research findings. This is a net benefit for science-probably more important than the peer review process.
 | A guest post by
|
This is a marvelous and appropriate analysis. I hope the authors will attempt to get this printed in JAMA as, sadly, their reach is far beyond yours.
I appreciate "COD reports are not reliable!" Seems to be such low lying fruit for study to improve "Medicine!"