
The Meta-research Study I Want to See
I hope you are listening, Drs. Ioannidis, Prasad, Jena...

Everyone’s goal for the future of medical research is more good studies and fewer bad ones. Even our best study design, the randomized, placebo-controlled trial, frequently produces questionable results. Is there a way we can rid the literature of poorly done RCTs that produce misleading data? What follows is a proposal for a meta-research study that I am absolutely convinced will identify where unreliable research is published and reduce demand for it.1 If this study were done, it would improve the quality of medical research, reduce the clutter of medical journals, and get more doctors back to the job of seeing patients.
The Funnel Plot
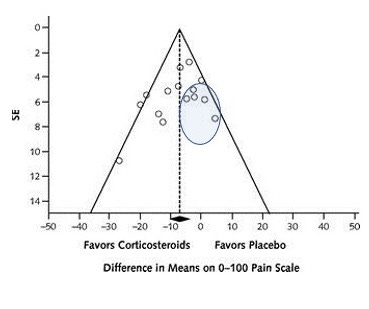
The funnel plot, common in meta-analysis, is my favorite figure. Its intention is to identify publication bias. The funnel plot graphs individual studies with their effect size on the X-axis and a measure/correlate of their sample size, usually the standard error, on the Y-axis. A classic funnel plot looks like this one from an article published in Annals of Internal Medicine on the efficacy of lumbar epidural steroid injections for sciatica.

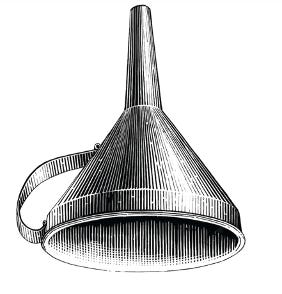
Here is the actual funnel you are supposed to be reminded of:
The graph from the Annals article does not identify publication bias. When publication bias exists, the graph will lack one part of the funnel, because (usually) smaller, negative studies have not been published. Therefore, studies that fit this description will be missing – those in the oval below:
A New Use for the Funnel
What if we use the funnel plot in a different way — to identify journals that reliably publish inaccurate studies? In a meta-analysis, we have identified the truth — also known as the mean effect size.2 The results of large, well-done studies and well-done small studies will closely approximate truth. Poorly done studies, and a random selection of small studies, will produce results farther from the truth. So, let’s instead see the funnel plot not as a funnel but as a superimposed pipette and colander:
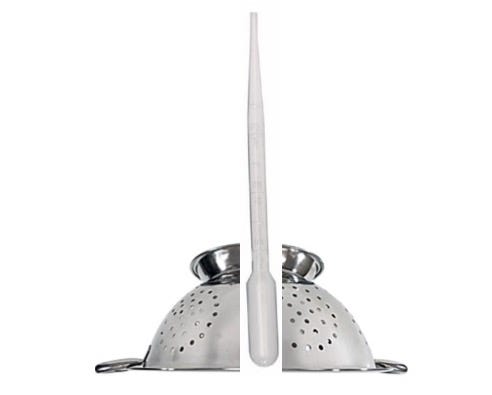
What we now have is the “pipette of truth” and the “colander of distraction.” I’d hypothesize that if we attached some measure of journal quality (probably the impact factor) to each point (study) on the original funnel plot we would find that the higher quality journals routinely publish studies that fill the pipette of truth while lower quality journals routinely publish articles whose results fill the colander of distraction – either because they are smaller or because they are large but of low quality.3
OK, so what is the meta-research I want to see done? Take 100 meta-analyses. In each one, label each point in the funnel plot with the impact factor of the journal that published the study. (The points in the funnel plot from the Annals meta-analysis represent studies published in journals with impact factors ranging from 4.2-9.3). Next, define what counts as being within the pipette or within the colander. This is probably just a measure of “distance” away from the mean effect size. I would hypothesize that we find a strong correlation between lower impact factors and the likelihood of being in the colander rather than the pipette. As you go from pipette to colander (or spout of the funnel to its bowl), you go from higher quality journals to lower quality ones.
The results of our study will allow us to identify an “unreliable impact factor” (UIF, pronounced whiff). The UIF correlates strongly with the tendency to publish RCTs that fill the colander of distraction. Journals with an impact factor below the UIF are not trustworthy. These are misleading journals.4
Using the Results
How would I hope that academic medicine would respond to these results? Misleading journals could either be forced to cease publishing altogether or be limited to publishing critiques, thought pieces, and reflections.5 The physician-researchers who primarily publish in these journals could spend more time improving medical care by seeing patients.
I will leave it to the researchers who take up this project to comment on the flaws in my reasoning here (I can’t imagine there are any).6 These researchers could also comment on the off-target consequences of limiting what lower-quality journals could publish. I look forward to reading the final paper. I would appreciate an acknowledgement or perhaps even being included as author six of seven.
This is, in fact, the only thing about which I am absolutely convinced.
I write this with my tongue placed firmly in my cheek.
Yes, I know I am filling an upside-down colander, which by definition has holes in it, but just go with me here.
I’d refer to these as MJs, but as a Chicagoan I can’t do that.
You know, the things that fill a good portion of my CV.
See 2.
- Or we might find that impact factor means squat.
- Don't forget this novel funnel plot use could itself have publication bias. What journals reject more trials that have negative results? High-impact or low-impact ones? This study might also find something about that. Or the results might also be thrown by the publication bias.
- Maybe also do this same type of study, but instead of doing 100 funnel plots, each representing 1 meta-analysis, do just 1 funnel plot that has 100 meta-analyses each on the same age-old question.
- Or maybe do it, but only examining efficacy of placebos. A kind of negative control.
- Also journal impact factor may not be the best measure. May want to in addition look at a standardized measure of the impact of the specific papers in question. The metric would have to adjust for year of publication being more or less "poppin'". One might find outliers, like the most inflammatory or the most inaccurate studies get shared the most. There might a a goldilocks zone. If you found that zone you could do the original study on journal impact factor all over again, but restricting analysis to studies that were in that goldilocks zone. Or do the same thing in the reverse order.
- Or maybe we may learn more about how we suck at interpreting funnel plots:
https://pubmed.ncbi.nlm.nih.gov/10812319/
https://pubmed.ncbi.nlm.nih.gov/16085192/
- Need low-impact due to gatekeeping. How many doctors know some RCT says black seed oil cures 40% of kidney stones? Or that a whole-foods plant-based diet can remit diabetic neuropathy? Or an RCT says melatonin cut covid mortality 90% in some hospital? etc etc etc.
- Lastly, if you find that low-impact journals have higher quality, make sure to submit your results to a high-impact journal so you can get rejected and publish low-impact. "Study in low-impact journal claims low-impact journals are better." Or conversely, "Study in high-impact journal says low-impact journals are better. Journal's impact factor soars."
It's 4am...hope this is still coherent in the morning.
If I recall correctly a similar proposal was made in Stuart Ritchies' "Science Fictions" which offered ideas to "right the ship" of the replication crisis.
On this argument you propose....:
"I’d hypothesize that if we attached some measure of journal quality (probably the impact factor) to each point (study) on the original funnel plot we would find that the higher quality journals routinely publish studies that fill the pipette of truth while lower quality journals routinely publish articles whose results fill the colander of distraction"
Can we trust "higher quality journals" when even the NEJM publishes obvious nonsense like "Lifting Universal Masking in Schools — Covid-19 Incidence among Students and Staff"?
https://www.nejm.org/doi/full/10.1056/NEJMoa2211029
Quick, obvious issues with the Boston study:
1) Figure 1 shows that the students in the schools which would eventually lift their mask mandates had much higher cases before the mandates were lifted, indicating that whatever caused these districts to have higher cases was happening before masks removed. Yet the authors cut this off by starting the graph in figure 1 in February, though it is clear cases were much higher in January. Classic technique of data drudging.
2) The authors apparently didn't realize that 13 of the schools they counted as "keep mandate" had successfully received an exception earlier (there was a condition that if you meet a % of vaccination you could be exempt from mask mandate).
You can cross reference this list with table S1 to see the 13 schools they missed:
https://www.cbsnews.com/boston/news/massachusetts-schools-mask-mandate-lifted-list-dese/
Example of one of the schools lifting it: https://www.kingphilip.org/important-mask-update-2/
3) One of the authors, when questioned on the lack of accounting for testing differences (many schools had students taking twice a week antigen tests, other schools used the CDC guidance that you only need to test for exposure when not wearing masks) argued that you should just trust her, because she has a PhD.
(edit: forgot to add source: https://twitter.com/EpiEllie/status/1557497452781096960?s=20&t=20X-EaQtKJAw3a0mwTzSTg)
4) The authors successfully organized a successful Change.Org campaign to get masks back on kids in Boston earlier that year, yet make no mention of this conflict of interest in their disclosures
https://twitter.com/EpiEllie/status/1429102872470433795
5) One of the authors had penned the Op-Ed in the Boston Globe "It's too soon to lift the school mask mandate", also didn't disclose this conflict of interest
https://www.bostonglobe.com/2022/02/11/opinion/its-too-soon-lift-school-mask-mandate/
6) Just as aside, almost all of the authors are on record being supportive of masking children prior to the study. Is it any surprise that they would be able to find high efficacy using one of the lowest tiers of evidence?
____________________
If the NEJM can publish nonsense like this, are there perhaps bigger problems to address before fixing meta research bias?