
The Quandary of a "Positive" Trial with a Non-significant Result?
The MINT trial tested two strategies of dealing with a common problem. The results seem clear. Except for the statistical test.

Don’t get hung up on the specific medical problem. The point of this Study of the Week is how to think about trial results.
The medical question comes up pretty often:
What to do with moderate anemia (low red blood cell counts) in a patient recovering from a heart attack (myocardial infarction = MI)? (We measure something called the hemoglobin level or Hgb to quantify the anemia.)
The two answers are a) be liberal and transfuse blood, or b) be restrictive and withhold blood unless the Hgb level gets really low.
The MINT trial tested these two strategies. No drug companies. No devices. Just strategies. I love it!

The background
After a heart attack, the heart muscle needs to recover. In favor of transfusing is the argument that having enough red blood cells may help oxygen delivery and limit damage. But, on the other hand, giving blood comes with the risk of volume overload, infection, clotting and inflammation.
Previous trials of treating anemia in post-MI patients have been small and inconclusive. But, in general, blood transfusion strategies have been studied in many other clinical situations. A Cochrane review of trials of more than 21K patients have shown that restrictive strategies have led to a 50% decreased use of blood without differences in morbidity or mortality.
In the hospital, restrictive transfusion policies are in vogue.
Some Details of MINT
The restrictive strategy reserved transfusion for Hgb = 7-8 g/dl vs the liberal strategy that allowed transfusion for less than Hgb 10 g/dl.
The primary outcome was strong—MI or death at 30 days. About 3500 patients were randomized equally to either strategy.
Patients were age 72 years; they had normal heart function and the median Hgb = 8.6 g/dl.
The results:
The mean number of red-cell units that were transfused was 0.7 in the restrictive-strategy group and 2.5 in the liberal-strategy group. That makes sense.
This resulted in a Hgb level that was 1.3 to 1.6 g/dl lower in the restrictive-strategy group than in the liberal-strategy group.
Death or MI, the primary outcome, occurred in 16.9% of patients in the restrictive strategy vs 14.5% of patients in the liberal strategy.
Notice there are no hazard ratios in the main figure. I am not sure why.
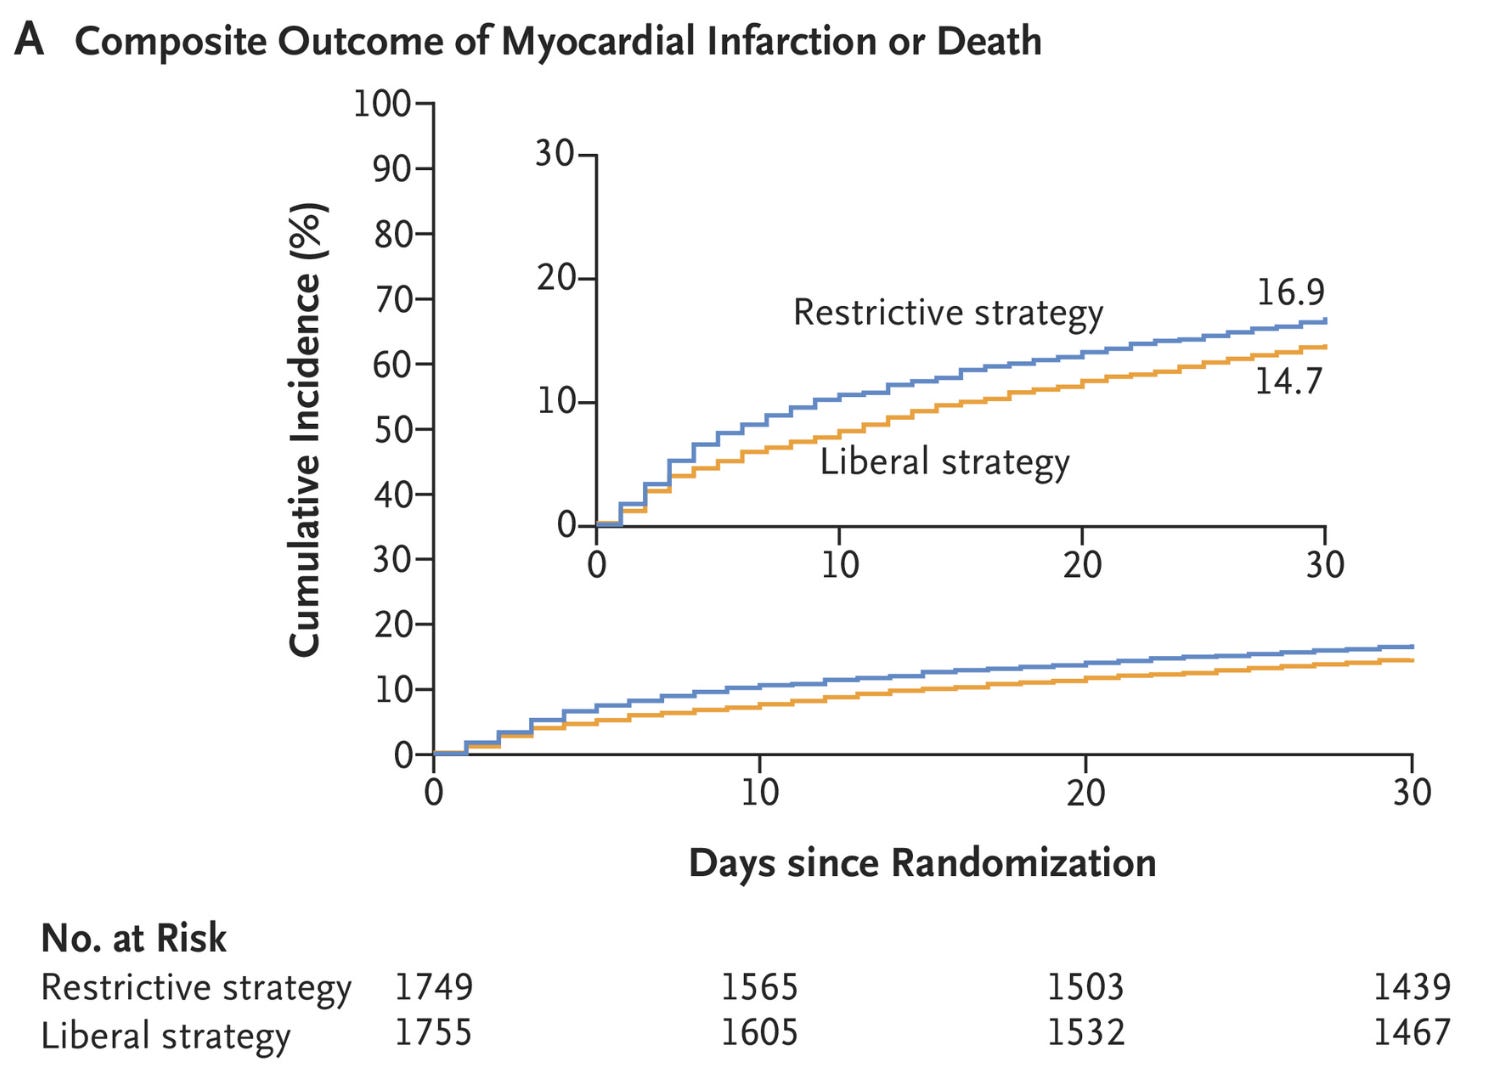
To my eyes, and probably yours too, the the liberal strategy looked better.
The absolute risk reduction was 2.4%. And. This was a strong endpoint.
The Main Question
Was this significant? That is the hard part.
The crude risk ratio for restrictive vs liberal was 1.16 or 16% worse. The 95% confidence intervals (CI) ranged from 1.00 to 1.35. We usually say that if 1.00 or no difference was included it is not statistically significant. But it gets slightly more complicated.
There was incomplete follow-up on 20 patients in the restrictive group vs 37 patients in the liberal strategy. group.
Now, with adjustment techniques called multiple imputations, the estimated risk ratio came out to 1.15 with CI to 0.99-1.7 and a p-value of 0.07. Darn it. The p-value is now greater than the threshold of 0.05.
But let’s look at some other endpoints.
Death was 19% higher in the restrictive arm. MI was also 19% higher in the restrictive arm.

Here is another endpoint: Death due to cardiac disease was 74% higher in the restrictive arm. The CI went from 1.26 to 2.4.
The frequency of heart failure and other safety-outcome events were similar in the two transfusion groups.
The conclusion in the New England Journal of Medicine has a hedge. (Italics)
In patients with acute MI and anemia, a liberal transfusion strategy did not significantly reduce the risk of recurrent myocardial infarction or death at 30 days. However, potential harms of a restrictive transfusion strategy cannot be excluded.
Comments
I like this conclusion and this trial. It makes you think.
The last phrase adds nuance to the interpretation. I think common sense and strict statistical thresholds (p= 0.05) come into tension.
I am biased about blood. I think in the setting of an MI, when you want to limit myocardial injury, it makes sense to have enough red corpuscles delivering nutrients.
But you could come back and say, come on Mandrola, you are the evidence person, there are oodles of studies that find that restrictive strategies of blood transfusion save blood products without affecting outcomes. And this is a negative result!
I may be wrong, but I think we need to look at this trial with more common sense than statistical testing.
There were more primary outcome events in the restrictive strategy. 2.4% is not a small increase in risk in a cardiac trial.
The 95% confidence intervals for the primary outcome mostly include worse outcomes: 0.99-1.34. That translates to the restrictive strategy being 1% better to 34% worse. The bulk of that interval is worse.
Each component of the primary outcome (MI and death) were higher in the restrictive strategy.
CV death was higher in the restrictive strategy.
There were no differences in adverse events.
I hope that there will be many experts who read this post. Tell me how you feel.
My take is that…
If I’ve got a post-MI patient with a hgb of 8.5, and I think blood would help, the MINT trial supports a transfusion.
But. It doesn’t compel us to transfuse. It doesn’t lend itself to algorithms or quality measures.
And that’s my favorite part. It provides evidence but allows clinical judgement.
What do you think?
The problem here is relying on the dichotomous yes/no that comes from hypothesis testing-P values. Although the P value was not significant because the CI crossed 1.0, there was a 95% chance that the true HR was somewhere between 1.0 and 1.35, favoring liberal blood transfusion. Almost all of the effect embodied in the CI favored liberal transfusion. To me, the conclusion of this study is that there is reasonable evidence that liberal transfusion is beneficial in this population and that more evidence is needed to use the results of this trial in clinical care. If the HRQOL outcomes (yet to be reported) favor blood transfusion, I would conclude that when the totality of effects are accounted for, a liberal transfusion should be considered for these patients.
I come from a statistics and research methodology background rather than a clinical background, although I've been involved in a hundred clinical studies. As such, I cannot fathom why and how researchers still obsess about whether p is above or below 0.05 as if the latter is some natural constant, or equivalently whether the 95% CI contains the null value. The founders of modern statistics including Fisher himself advised flexibility with the cutoff depending on the circumstances, while Neyman & Pearson and their successors emphasized that the cutoff should be chosen based on the costs of false positive (Type 1) vs false negative (Type 2) errors. And that is leaving aside the many (including me) who advise that such cutoffs should not be the basis for decisions, and should serve only as convenient reference points much like labeled points on a graphical axis. Conclusions about treatment effects need other information, including P-values for alternatives of clinical importance such as a minimal clinically important difference. The CI shows quickly where those alternative P-values are relative to 0.05, but better still is to look at them directly.
Here are a few of the many open-access articles my colleagues and I have written recently trying to stem this unhealthy compulsion to treat 0.05 as some magic number or universal constant of science; the first lists common mistakes traceable to that compulsion, the others detail how to reorient one's thinking to get a valid picture of the statistical information in a trial, including information about possible effect sizes other than the null:
Greenland, S., Senn, S.J., Rothman, K.J., Carlin, J.C., Poole, C., Goodman, S.N., Altman, D.G. (2016). Statistical tests, confidence intervals, and power: A guide to misinterpretations. The American Statistician, 70, online supplement 1 at https://amstat.tandfonline.com/doi/suppl/10.1080/00031305.2016.1154108/suppl_file/utas_a_1154108_sm5368.pdf, https://www.jstor.org/stable/44851769
Rafi, Z., Greenland, S. (2020). Semantic and cognitive tools to aid statistical science: Replace confidence and significance by compatibility and surprise. BMC Medical Research Methodology, 20, 244. doi: 10.1186/s12874-020-01105-9, https://bmcmedresmethodol.biomedcentral.com/articles/10.1186/s12874-020-01105-9, updates at http://arxiv.org/abs/1909.08579
Greenland, S., Mansournia, M., Joffe, M. (2022). To curb research misreporting, replace significance and confidence by compatibility. Preventive Medicine, 164, https://www.sciencedirect.com/science/article/pii/S0091743522001761