
When Population Health and Individual Health Clash
The Study of the Week creates tension in the cardiac prevention world

First some background from my clinic. Here is how the conversation goes:
Patient: “Doc, should I take this cholesterol drug that my primary care doctor prescribed?”
Me: “What did your risk score come out as?”
Patient: “What?”
It stuns me how few doctors use the pooled cohort equation to guide use of primary prevention treatments. Most often, patients tell me that their doctor said the medicine would lower cholesterol—which is a good thing.
That reasoning may be correct, but it is insufficient.
The guideline-directed way to use primary prevention treatments (cholesterol and BP-lowering drugs) is to input basic data into the pooled cohort equation. It’s available online and I usually do it on the patient’s smartphone.
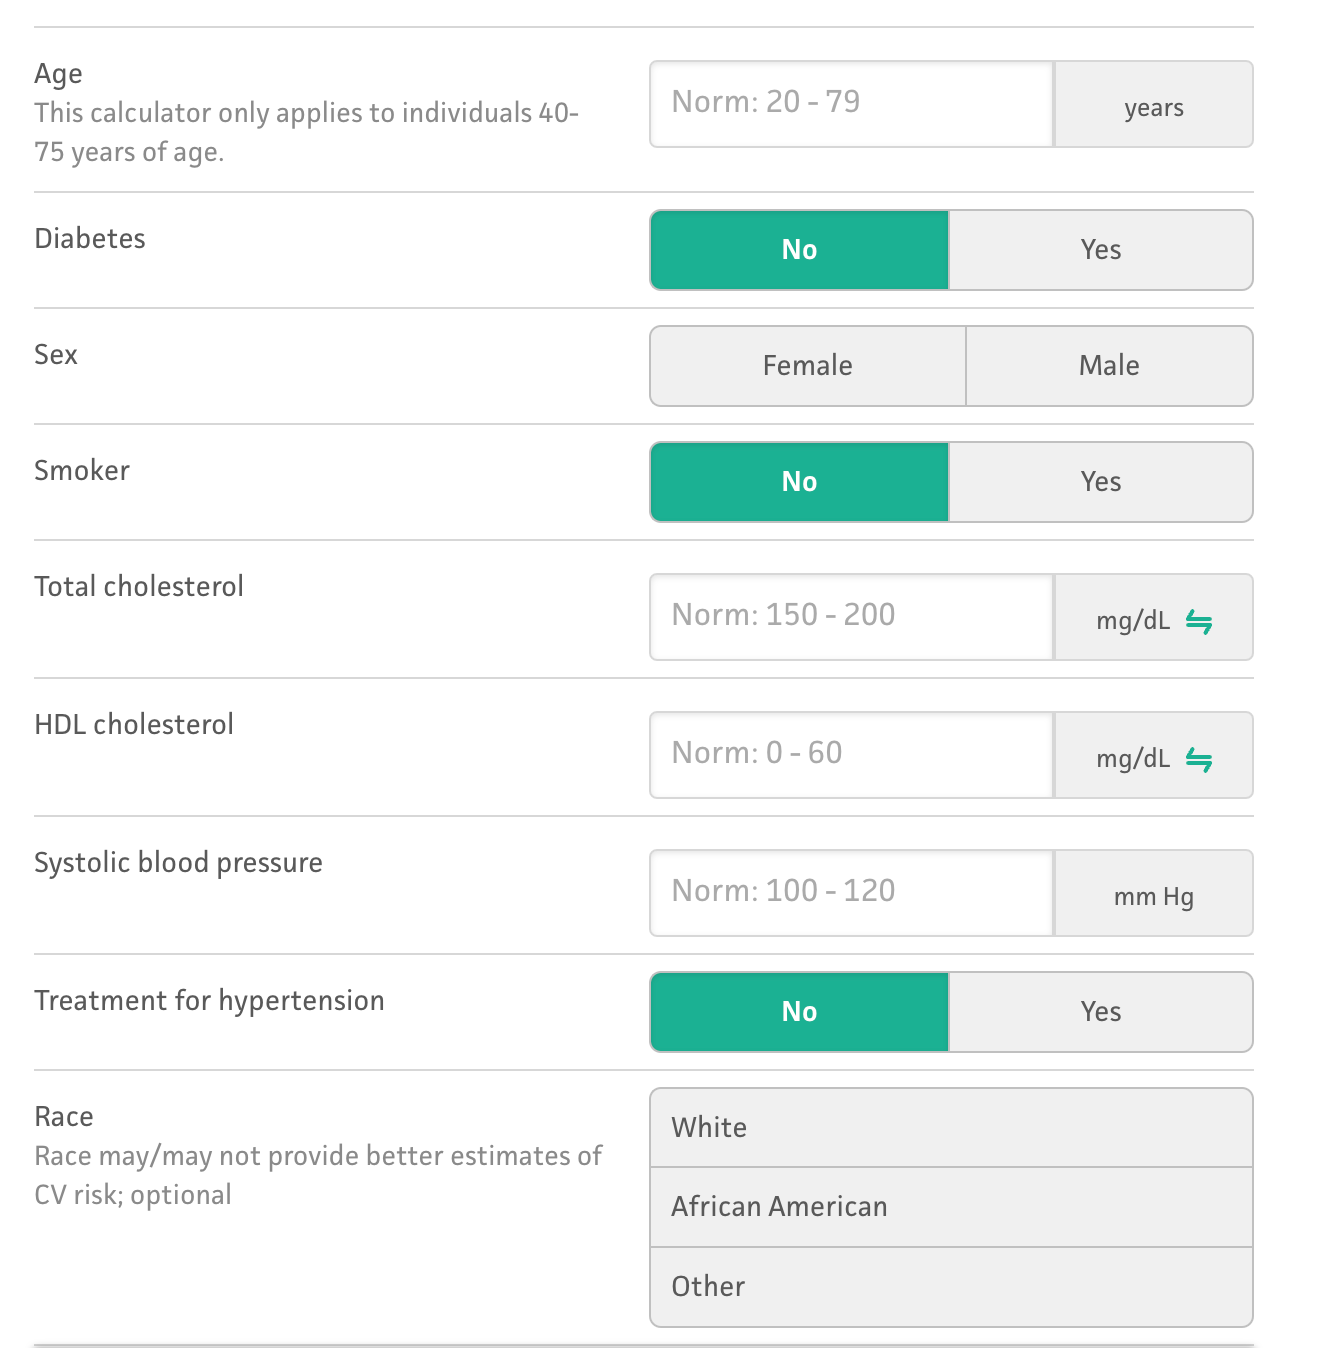
The PCE kicks out a 10-year risk of an MI or stroke. Statin drugs reduce that risk by ≈ 25%.
Example calculation: If the risk is high, say 20% over a decade, then the statin-risk reduction reduces the decade-long risk to 15% (.25 x 20= 5%). If the risk is low, say, 2.5% over a decade, then the statin-risk-reduction reduces the decade-long risk to 1.875%. (.25 x 2.5=0.625).
On a smartphone, a patient can see his or her risk on statins or off statins. Together with the doctor, they can decide whether it is worth taking a pill.
Now to the experts, who I like to call Top People
The Top People from the AHA and ACC say that if the 10-year risk exceeds 7.5%, the patient is “statin-eligible.” The USPSTF Top People say the 10-year risk should exceed 10% before the patient is declared “statin-eligible.”
Their judgement is that there exists an absolute risk wherein the relative risk reduction is worth taking a pill. They differ a bit on the threshold, but the point is that they have a threshold.
Having a threshold allows population health people to calculate the number of statin-eligible people in the population. Many statin-eligible patients don’t take statin drugs, which allows experts to say there is widespread statin underuse in the population.
There are problems with risk-based decision-making. One is that another group of experts think that the longer a person is exposed to a lower cholesterol, the greater the gain. The largest component of the PCE is age, so waiting until the PCE reaches a threshold, means patients are exposed to lower cholesterol levels for a shorter time than they would be if they had started the drug earlier in life.
The Study of the Week explores another problem with the risk-based decision-making.
The PCE is out of date. Experts from the AHA have come up with a new equation.
They call it the PREVENT equation. It’s derived and calibrated from much larger and more modern datasets. Here is a link to the calculator.
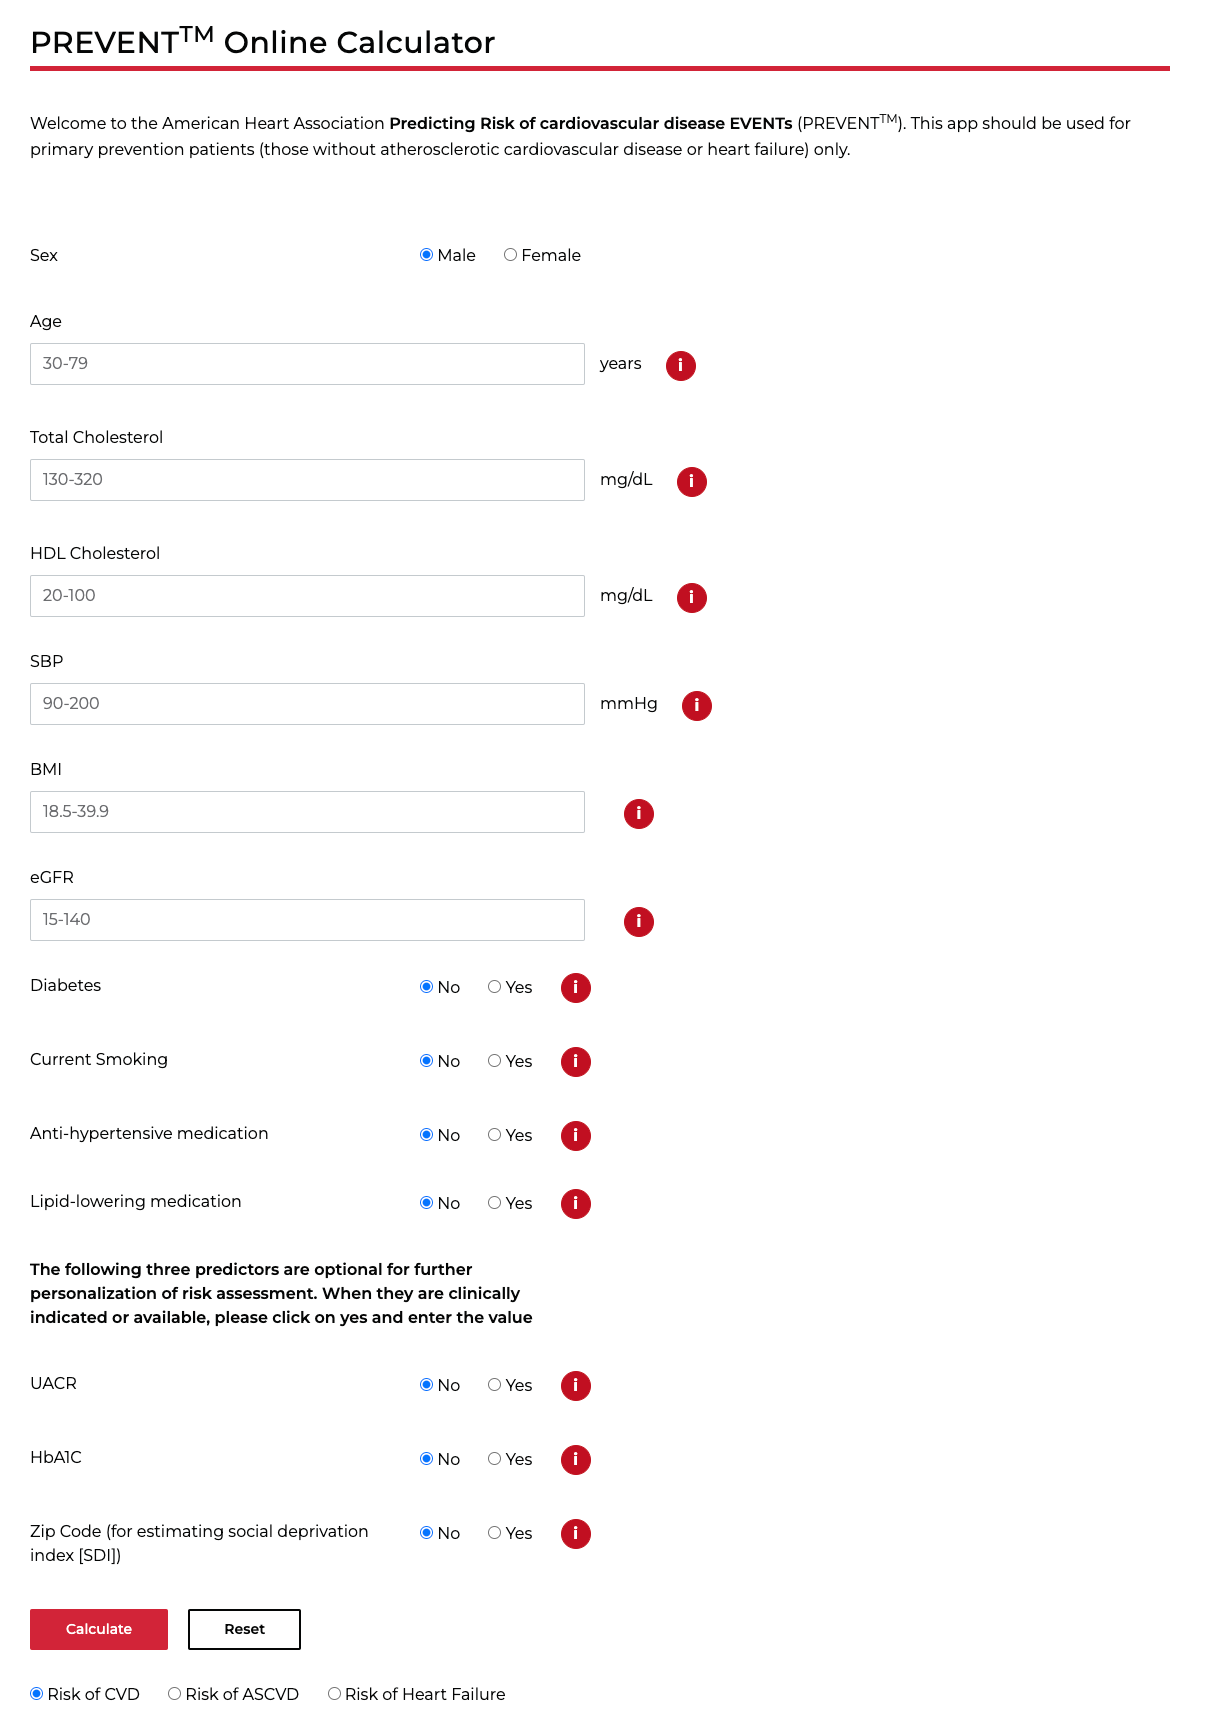
The new score incorporates kidney function (found with a basic lab test). It also does away with the race component of the PCE. And it allows input of the zipcode, which adds risk or benefit based on social situation.
Experts agree that PREVENT is a better estimator than the old PCE.
But. But. There is a problem.
Numerous investigators decided to compare the PREVENT and PCE equations. JAMA published their study last week. It was a shocker.

The new and improved PREVENT equation confers lower risk than the PCE. In fact, it reclassifies about half of US adults to lower risks than the PCE.
When applied to the US population, about 14 million adults would no longer reach that threshold of 7.5% ten-year-risk.
You might be thinking…what is the problem? PREVENT is more accurate. PCE probably over-classified people to higher risk.
Well, here is the problem: the authors then estimated the number of excess heart attacks that would occur with lower usage of statins. (They can make this estimate because trials have consistently shown that statins reduce future MIs by 25%.)
If PREVENT is applied to the US population, and the statin threshold remains at 7.5% ten-year risk, then they estimate more than 100,000 excess heart attacks.
The tension occurs because a more accurate assessment of risk leads to fewer people reaching the threshold that Top People recommend taking a statin. Fewer people on an MI-reducing medication means more MIs.
Yet I don’t see it that way.
PREVENT will not change my discussion with patients.
We will still enter their data into the PREVENT calculator and get a 10-year-risk. We then multiple that risk by 0.25 to get the absolute risk reduction with statin drugs. Now we have a ten-year risk off statins and ten-year risk on statins.
The patient can decide if that risk reduction is worth taking the pill.
Some patients are maximizers and want to do everything to reduce the risk of a cardiac event. It’s an easy decision for them. They take atorvastatin or rosuvastatin.
Some patients are minimizers and see a 2% or 4% or 6% risk reduction over a decade (of only one disease) as not very much. They say no thanks.
Many patients are between maximizers and minimizers. For them, we can talk about how to internalize a 2% or 4% risk reduction over a decade. It isn’t easy. Because a lot of things can happen to one’s health over a decade. I call these competing risks.
(This thinking can also be used for initiation of blood pressure drugs for non-severe high blood pressure.)
When patients and doctors decide on taking primary prevention therapies using these tools, the estimated incidence of MIs in the population does not matter.
That is why I don’t feel the tension that population experts feel regarding the re-classification of cardiac risk from a more accurate equation.
Clinicians treat patients not populations. Having a more accurate risk estimate is a positive. Treatment thresholds never made sense to me.
These guidelines are not free from bias. Who writes them? Where do they get their data and statistics?
Who came up with the 25% risk reduction?
What about the study that shows on a population level people who take statins for 5 years live 3-4 DAYS longer than those who don’t?
Statins have become more of a belief system than something that can be questioned.
I view these population based guidelines for individuals the same way I view weather forecasts. A 25% chance of rain means in your area there is a chance of rain over 25% of that area, but they never know which…..
Isn’t that what we are doing with population based studies when trying to extrapolate to the individual?
My advice to patients over many years of practice was to ignore things like risk calculators. They are based on inaccurate and mostly meaningless data such as cholesterol levels. Preventive medicine is largely a wishful fantasy. The doctor's function is to diagnose and treat disease. The figures on prevention are pretty pathetic. If you think that changing diet or exercise patterns will help you stave off disease, then go for it. But don't take medication that may alter your normal physiology. I would also spend time explaining how the figures quoted for risk reduction are very misleading. Typically, a 25% relative risk reduction means something like reducing absolute risk from 2% to 1.5%. Pointing this out usually reduces the enthusiasm for the "preventive" treatment.