
Improving Your Critical Appraisal Skills #5
Part 2 of Diagnostic Tests

The previous post in this series covered test characteristics and other metrics (positive and negative predictive value) of diagnostic tests. It also dove a bit into clinical reasoning. This post covers receiver operator characteristic curves and common problems in diagnostic test articles: spectrum bias, work up bias, and issues with reproducibility.
But first... a little test characteristic practice.
Question #1
Two studies define the test characteristics for rheumatoid factor (RF) in the diagnosis of rheumatoid arthritis (RA). Both run with the same assay in people with RA and age and sex matched controls. The gold standard in both studies is the diagnosis of RA by a team of expert rheumatologists. The results for the studies were as follows:
Study #1: sensitivity, 80%; Specificity, 95%.
Study #2: sensitivity, 82%; Specificity, 15%
Question: How can they have such different results?
Answer: The control populations, the non-diseased populations, in these two studies were very different. Maybe the controls in Study #1 were healthy, community controls while those in Study #2 were people without RA in the rheumatology clinic.
Question #2
Go back several years to when we were trying to figure out if we could use CT scans to rule out subarachnoid hemorrhages. Until that time, the test of choice was a lumbar puncture (LP). As the researcher, you know it is going to be hard to do a perfect study in which every patient in the ER who has a head CT for a suspicious headache will also get the gold standard, an LP. Sometimes the doctors will say, “Well we don’t know if CTs are perfect, but my suspicion isn’t that high and the CT is negative, so I am comfortable taking my (and the patient’s) chances.” This might be clinically appropriate but if all people with normal CTs don’t get LPs you will not be able to calculate sensitivity or specificity (or negative predictive value for that manner).1
Thus, you design a study wherein anyone in the ER with a headache who gets both a CT and an LP will be enrolled.
Question: What is the problem with this design?
Answer: People who have negative CTs who also have a LP are a special set of patients. Most likely they are people for whom the treating physician has a high suspicion. This sample is probably not representative of the entire ER headache population.
Question #3
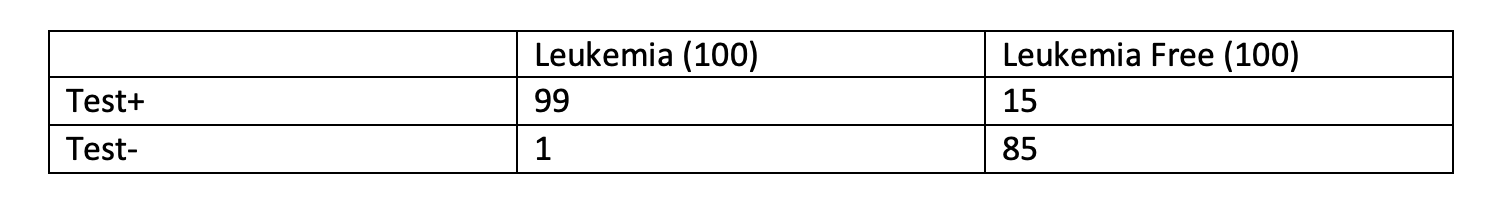
You’ve developed a new blood test for leukemia. Your gold standard test is bone marrow biopsy, which is kind of miserable, so you would like to avoid it if possible. Because the treatment, chemo, is also pretty miserable, everyone who tests positive will need the gold standard before treatment. The test characteristics for your new test are: sensitivity, 99%; specificity, 85%.
Question: If you have 200 patients, with a 50% likelihood of disease, how many people would be appropriately spared a bone marrow biopsy by this test.
Answer: 85 appropriately spared and 1 inappropriately spared. (And, you would still be performing bone marrows on 15 people without disease.)
Cut Points
For most tests, we must decide where we draw the line between normal and abnormal. Below what hemoglobin is someone anemic? How many dividing nuclei on a slide makes a sample cancer? How many bowel movements each day are too many? Cut points need to be chosen. Figure 1 represents a “gold standard” test. A cut point can be drawn that perfectly separates two populations.
Figure 1

Most tests are not like this. Figure 2 represents the performance of a more realistic test. Most people with a positive test have disease and most people with a negative test do not but there are also false positives and false negatives.
Figure 2

Because specificity is defined in people without disease, specificity is the ratio of true negative tests to all results above the horizontal axis. Sensitivity is defined by the ratio of true positives to all results below the horizontal axis. In figure 3, you can see that the test characteristics will change as the cutoff point does. If we move the cut point to the left, sensitivity will improve but specificity will fall.
Figure 3

If we were to move the cut point to the right, the opposite would happen -- specificity would increase but sensitivity would fall. An increase in one test characteristic is always at the expense of the other.
Receiver Operator Characteristics (ROC) Curves
The relationship between sensitivity and specificity can be graphed in a receiver operator characteristic curve with sensitivity (true positive rate) on the Y-axis and 1-specificity (false positive rate) on the x axis.2
Figure 4

ROC curves can be used to compare two tests. The larger the area under the curve (AUC) the more accurate the test – the closer to the test in figure 1. ROC curves can also be used to choose the cut point in various situations. Look at the ROC in figure 5. This looks at the performance of an EKG for the diagnosis of MI. New ST segment elevation or Q-waves have nearly 100% specificity. Nonspecific ST-T changes are nearly 100% sensitive. An interventional cardiologist, tasked with deciding whether or not to open the cardiac cath lab in the middle of the night, might choose the former cut point while an ER attending deciding whether to further evaluate a patient with chest pain might use the latter.
Figure 5

Common Pitfalls
1. Spectrum Bias
Although test characteristics, sensitivity and specificity, are independent of prevalence, they are influenced by the spectrum of disease in the population in which they are defined. A chest X-ray may be better at diagnosing severe, lobar, pneumococcal pneumonia than at diagnosing mild, diffuse, mycoplasma pneumonia. This is why test characteristics are not just characteristic of the test but of the people in whom the test is deployed. A study defining test characteristics should include a broad range of diseased and non-diseased patients (or at least a spectrum similar to your patient population).
Question #1 above is a demonstration of spectrum bias. The spectrum of patients in the tested population defines the resulting test characteristics.
2. Verification Bias
In a diagnostic test study, every patient receiving the test being evaluated must also undergo the gold standard test. Results of one test must in no way affect the decision to perform, or the results of, the other.
Question #2 above is an example of verification bias.
3. Reproducibility
When you read a diagnostic test article, you need to make sure that the results presented in the study are reproducible in your practice (institution). The directions for how diagnostic tests were done should be given. How were examiners trained, what assay was used, what software was the CT scanner running?
In a diagnostic test study, results are often obtained from various examiners or at various institutions. Study examiners should have high levels of agreement. If the examiners in a study cannot agree on positive or negative results, it is unlikely you will be able to reproduce their findings. Inter-rater agreement is often given by the kappa statistic. Kappa is the actual inter-rater agreement beyond chance divided by the potential inter-rater agreement beyond chance. This is expressed as k = (O - C)/(1 - C), where O is the observed agreement and C is the chance agreement. If there are 2 observers who agree 75% of the time: k =.75-0.5/1-0.5=.50
Kappa of >.70 is generally thought to be excellent, .5-.7 is acceptable. Kappa of 0 is chance agreement and kappa of 1 is perfect.
Some diagnostic test studies that make for good reading:
Drage JS, et al. The Apgar Score as an Index of Neonatal Mortality. Obstetrics and Gynocology 1964;24: 222-230.
Catalona WJ, et al. Use of the Percentage of Free Prostate Specific Antigen to Enhance Differentiation of Prostate Cancer from Benign Prostatic Disease. JAMA 1998;279:1542-1547.
Stafstrom CE, et al. The usefulness of children's drawings in the diagnosis of headache. Pediatrics 2002;109:460-72
Pickhardt PJ, et al. Computed tomographic virtual colonoscopy to screen for colorectal neoplasia in asymptomatic adults. NEJM 2003;349:2191-2200.
Miller JM, et al. Diagnostic performance of coronary angiography by 64-row CT. NEJM 2008;359:2324-36.
Suzuki T, et al. Diagnosis of Acute Aortic Dissection by D-Dimer. Circulation. 2009;119:2702-2707
Sonoda H, et al. Colorectal cancer screening with odour material by canine scent detection. Gut 2011;60:814-819.
Chiu RWK, et al. Non-invasive prenatal assessment of trisomy 21 by multiplexed maternal plasma DNA sequencing: large scale validity study. BMJ 2011;342:7401
Imperiale TF, et al. Multitarget Stool DNA Testing for Colorectal-Cancer Screening. NEJM 2014;370:1287-97.
Hwang EJ et al. Deep Learning for Chest Radiograph Diagnosis in the Emergency Department. Radiology 2019; 293:573–580
Klein EA et al. Clinical validation of a targeted methylation-based multi-cancer early detection test using an independent validation set. Annals of Oncology. 2021;32: 1167-1177.
User’s Guide for Articles about Diagnostic Tests
Was there an independent, blind comparison with a reference standard?
Did the patient sample include an appropriate spectrum of patients to whom the diagnostic test will be applied in my clinical practice?
Did the results of the test being evaluated influence the decision to perform the reference standard?
Were the methods for performing the test described in sufficient detail to permit replication?
Are the likelihood ratios for the test results presented or are the data necessary for their calculation provided?
Will the reproducibility of the test result and its interpretation be satisfactory in my setting?
Are the results applicable to my patient?
Will the results change my management?
Will patients be better off as a result of the test?
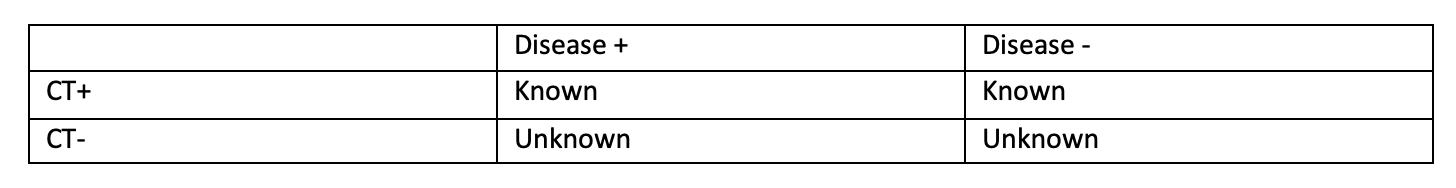
Your 2X2 table will look like this:
ROC curves were first developed during the second world war for the calibrating of radar. This article references some of the first papers.