
Improving Your Critical Appraisal Skills #4
Diagnostic Test Studies

If RCTs are the most useful study design, and articles about case control studies are my favorite to read, the use and interpretation of diagnostic tests and the articles that define test characteristics are my favorite to think about, talk about, and teach. I think this is because diagnosis is so core to what a general internist brings to health care. Given my enthusiasm, this topic will be covered in two posts.
Today will cover the design of diagnostic test studies and diagnostic test metrics, probability revision and the use of likelihood ratios, and clinical reasoning using testing and treatment thresholds. The next post will cover receiver operator characteristic curves and common problems with diagnostic test studies: spectrum bias; work up bias; and issues of reproducibility. The second post will also feature a list of fun articles to read.
Throughout this discussion, consider a diagnostic test in the broadest possible way: anything that is used to distinguish two populations. In medicine, these two populations are usually with and without disease. A test can be a historical feature, a physical exam maneuver, a radiologic procedure, or a laboratory test. Also, keep in mind that a diagnostic test rarely (if ever) excludes or confirms the presence of a disease. Diagnostic tests help us to revise our probability that a disease is present.
Design & Metrics
Studies that evaluate diagnostic tests do so by comparing a test to a gold standard -- a test considered flawless in differentiating two populations.1 The metrics that come out of these studies speak to the “performance” of the test in question. Our 2X2 table separates those who had a negative or positive result on the test in question into those who have the disease or don’t (according to the gold standard).

Test Characteristics
Test characteristics – sensitivity, specificity, positive and negative predictive value – are called test characteristics because they are -- wait for it -- characteristics of the test. You can look them up in a book. “How sensitive is a right upper quadrant ultrasound for the diagnosis of gallstones?” As we will get to, test characteristics are actually characteristic of both the test and the patient population that the characteristics were defined in.
Sensitivity
A/(A+C)
The probability that a test will be positive when the disease is present.
Notice that sensitivity only pertains to people with disease.
A highly sensitive test can help to rule out a disease (as it minimizes false negatives, so most negatives are true negatives).2
Mnemonic: Snout, sensitive rules out.
Specificity
D/(D+B)
The probability that a test will be negative when the disease is absent.
Notice that specificity only pertains to people without disease.
A highly specific test can be used to rule in a disease (as it minimizes false positives, so most positives are true positives).3
Mnemonic: Spin, specific rules in.
Real life examples:
At the airport, the metal detector you walk through is a sensitive test. It is very good at ruling out a large piece of metal. If you test positive, a specific test, wand or pat down, is used to rule in a weapon.
When I was a kid, my mother and I would occasionally forage for mushrooms. We would take a book, “Common Poisonous Mushrooms of the Northeast.” This was a sensitive test to rule out poisonous mushrooms. At home we had “Edible Mushrooms of New York and New England.” This was a specific test to rule in edible mushrooms.4
Positive and Negative Predictive Value
Positive and negative predictive value are not test characteristics because they are affected by the prevalence of disease in a population, the ratio of diseased to non-diseased people. They do represent the numbers that we are most interested in.
Positive Predictive Value
A/A+B
The probability of disease given a positive test
Negative Predictive Value
C/C+D
The probability of disease absence given a negative test
Because positive and negative predictive values depend on prevalence, a highly specific test, one that should be good at ruling in disease, will have a low positive predictive value if performed in a population with an extremely low prevalence of disease. This is a big problem when we talk about screening tests. It is the reason that we carefully select patients for screening. We do not recommend lung cancer screening in all patients, only those at high risk for lung cancer.5 Example:
1000 patients Prevalence = 10 %
Sensitivity = 99% Specificity = 99%

A positive test, that should “rule in” disease since the test is highly specific, only gives a “posttest probability” of disease of 50%.
Likelihood Ratios
Likelihood ratios are based on sensitivity and specificity; thus they are test characteristics. They are useful because they allow you to easily calculate posttest probability given pretest probability and test characteristics.
The likelihood ratio for a positive test tells you how much more likely it is that a result is a true positive, as opposed to a false positive. You therefore want the positive likelihood ratio to be a big number:
Positive likelihood ratio (LR+) = sensitivity/(1-specificity)
The likelihood ratio for a negative test tells you how much less likely it is that a result is a false negative, as opposed to a true negative: therefore, you want the negative likelihood ratio to be small:
Negative likelihood ratio (LR-) = (1-sensitivity)/specificity
Probability Revision and the Use of Likelihood Ratios
I think that likelihood ratios are probably best understood by seeing them in action. We use likelihood ratios to revise the pretest probability of disease to a posttest probability. Probabilities need to be converted to odds to use likelihood ratios.
Odds = p/(1-p) Probability = o/(1+o)
Suppose you have a test that predicts death in the three months after an MI with a sensitivity of 95% and a specificity of 60%. A patient presents with an acute MI. Based on your experience and the results of other tests you suspect that he has a 30% chance of dying in the next 3 months (pre-test probability). You perform the test. What is his “post-test probability” of dying in the next three months if his test is positive? What is his “post-test probability” of dying in the next three months if his test is negative?
Positive likelihood ratio (LR+) = sensitivity/(1-specificity) = .95/(1-0.6) = 2.38
Negative likelihood ratio (LR-) = (1-sensitivity)/specificity = (1-.95)/0.6 = 0.08
Pretest Probability = 0.30
Pretest Odds = 0.3/(1-0.3) = 0.43
Positive test
Odds X LR+ = 0.43(2.38) = 1.02
Posttest Probability = 1.02/(1+1.02) = 50%
Negative Test
Odds X LR- = .43(0.08) = 0.03
Posttest Probability = 0.03/1+0.03 = 3%
These results should not be surprising. The test was more sensitive than specific so it should be better at ruling out disease than ruling in disease.
Tests with LRs >10 or <0.1 cause the greatest shifts in probability
Tests with LRs of 5-10 or 0.1-0.2 cause moderate shifts
Tests with LRs of 2-5 or 0.2-0.5 cause small shifts
Those with LRs of 1-2 or 0.5-1 are essentially worthless
Clinical Reasoning and Testing and Treatment Thresholds
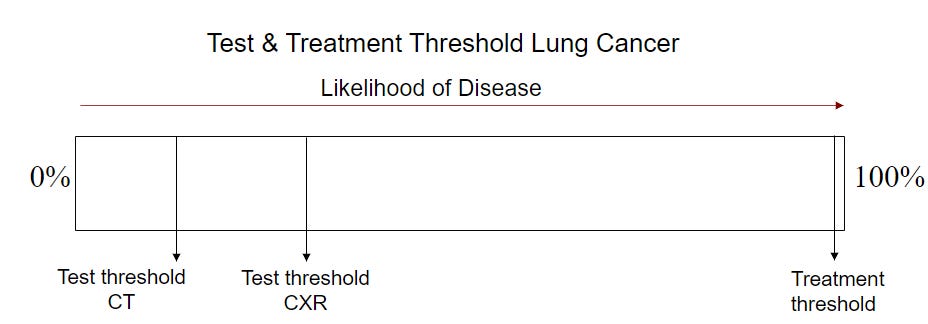
It is hard for me to write about diagnostic tests without a little bit of a dive into diagnostic reasoning. I always think about this topic in the way outlined in this spectacular NEJM article from 1980(!). When we consider a differential diagnosis. We consider possible diseases and whether we need to test for them. This figure reproduces the thinking behind the decision making.

The test threshold is the disease probability above which you would employ a diagnostic test to rule in or out disease and below which you would feel comfortable concluding that the disease is not present. The testing threshold will be lower for more serious diseases. Testing thresholds also depend on the available diagnostic tests. If the test is invasive, your testing threshold will be higher.
The treatment threshold is the pretest probability above which you would feel comfortable treating without further diagnostic information. The treatment threshold will be higher for diseases with potentially dangerous therapies and lower for diseases with well tolerated ones.
Consider lung cancer as an example of a disease for which you might test. Given the severity of the disease and the prognostic value of making a diagnosis, the testing threshold is low. The threshold is lower for a CXR than a CT given the cost of the tests. Given the morbidity of the therapy, the treatment threshold is very high.
Of course, is any test really perfect at differentiating two populations? The quality of the “gold standard” is important to consider when you appraise these studies.
This should be confusing as sensitivity is used to rule out disease even though it comes from the population of study participants who have the disease.
Ditto. This should be confusing as specificity is used to rule in disease even though it comes from the population of study participants who are free of disease.
These tests obviously worked perfectly as I am still here writing this post.
Currently, the USPSTF guidelines are to screen people between 50 and 80 years of age who have a 20 pack-year smoking history and who currently smoke cigarettes or quit within the past 15 years.
Thank you for summarising so clearly the basics of the current state of play on appraising diagnostic test studies. However, there have been concerns about these methods for some time (e.g. Limitations of Sensitivity, Specificity, Likelihood Ratio, and Bayes' Theorem in Assessing Diagnostic Probabilities: A Clinical Example, Moons et al (Epidemiology 1997; 8, 12-17). At best the above indices allow provisional comparison between different diagnostic tests (especially for epidemiologists e.g. PCR and LFD tests for Covid-19). However, they leave open some important questions for clinicians, e.g.:
1. How do you decide when a disease should be ASSUMED to be present (in the form of a diagnosis based on criteria) especially as the diagnostic (not disease) criteria will be on a spectrum of severity? Should we be basing this on probabilities of outcomes in RCTs conditional on estimated disease severity on recruitment?
2. How do you assess the ability of test results of varying degrees of severity to create helpful lists of differential diagnoses?
3. How do you interpret the non-dichotomised numerical values of test results required to differentiate between differential diagnoses? Ratios of pairs of sensitivities based on dichotomised results created by thresholds (as in Pauker & Kassirer, 1980) are used sometimes.
I explore some of these issues in the Oxford Handbook of Clinical Diagnosis (http://oxfordmedicine.com/view/10.1093/med/9780199679867.001.0001/med-9780199679867-chapter-13 ). I am currently completing the 4th edition.
There is an error in the NPV as its d/c+d isn't it ?